For nearly 15 years, Endeavor supported entrepreneurs as “venture capital without the capital.”
Then founders in our community pointed to something missing: financial backing could be a powerful signal of confidence, helping unlock funding in overlooked markets.
In 2011, Reid Hoffman and other Endeavor Global Board Members helped us develop a model that would do both:
Keep selecting outstanding entrepreneurial talent regardless of their “fundability.”
And invest in Endeavor companies raising equity rounds from qualified institutional investors.
Endeavor Catalyst launched in 2012 as a rules-based co-investment fund. It has since seen and helped shape many eras of global entrepreneurship.
Five funds, five eras
2012 – 2017
Fund I The rise of digital & consumer technology
$27Mraised48companies
Cornershop (Chile/Mexico)34x Acquired by Uber for $3B+
Peak Games (Türkiye)25x Acquired by Zynga for $1B+
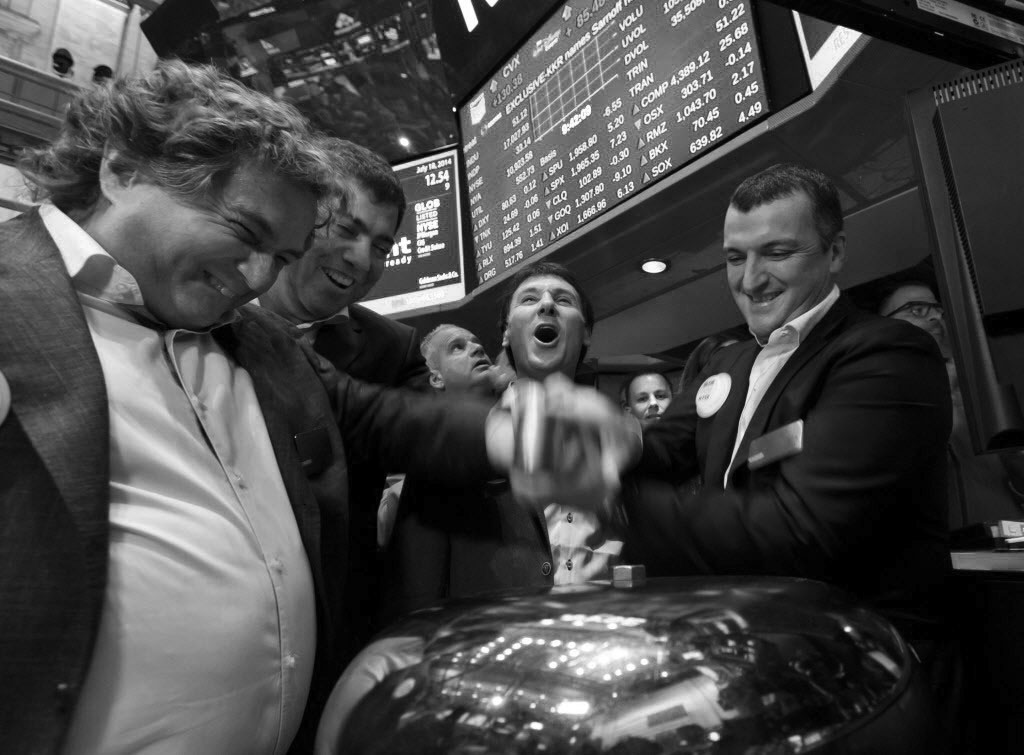
Globant (Argentina)3x IPO at $400M
Clip (Mexico)18x $500M rounds at $2B+ valuation
2017 – 2019
Fund II Focus on enterprise and infrastructure platforms
$73Mraised78companies
Mural (Argentina)16x Partial secondary sale
InstaDeep (Tunisia)10x Acquired by BioNTech for $650M+
Altruist (Detroit)30x Acquired by Vanguard for $4B+
Ebanx (Brazil)21x Partial secondary sale
2019 – 2022
Fund III Companies go global at scale
$115Mraised110companies
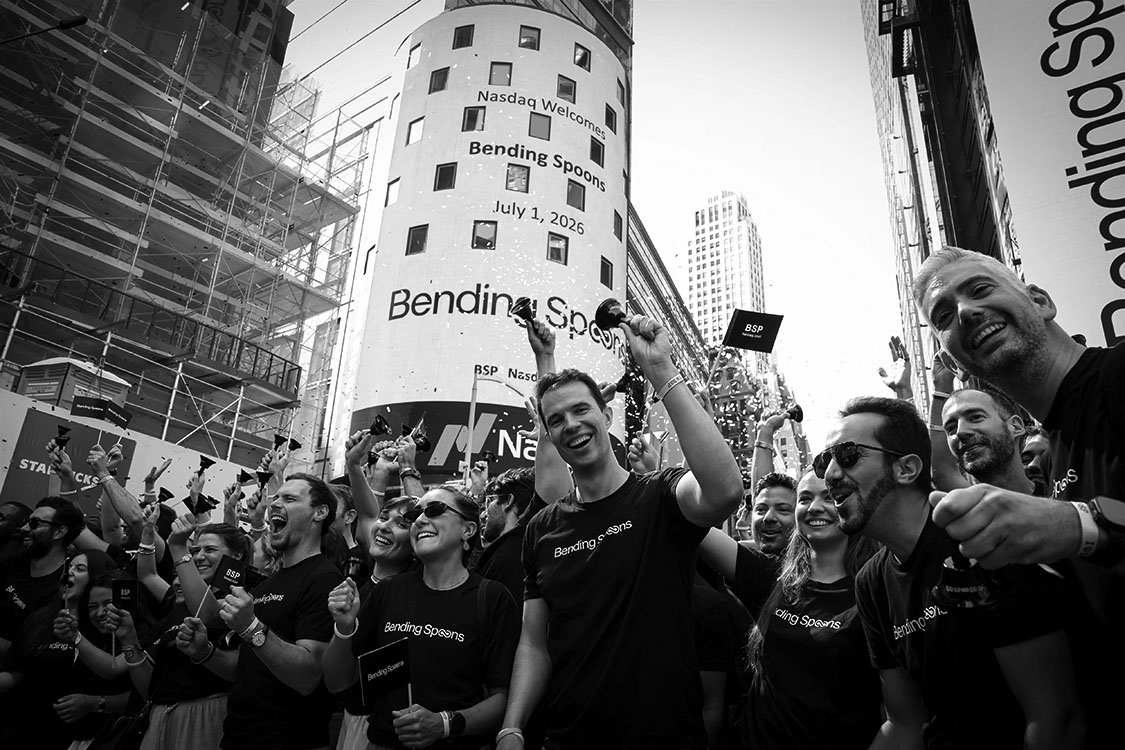
Bending Spoons (Italy)30x IPO on Nasdaq at $18B; valued at $28B as of Aug. 28, 2026
dLocal (Uruguay)10x IPO on Nasdaq at $6B
Flutterwave (Nigeria)11x Series E round at $3B+
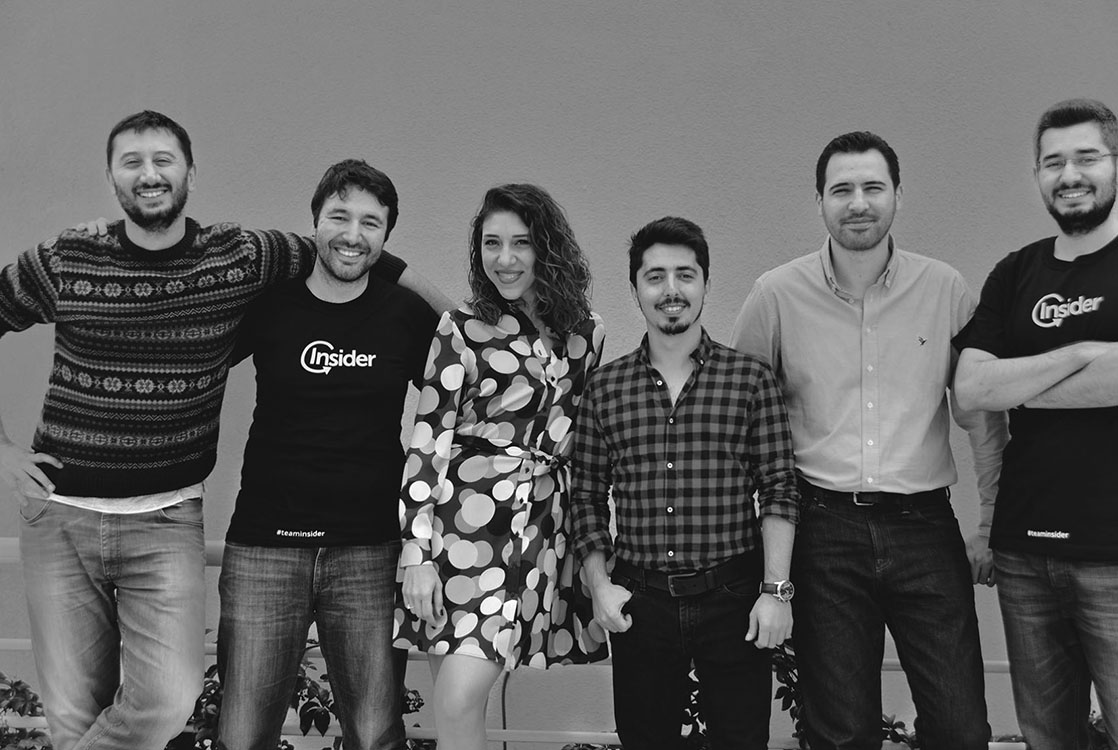
Insider (Türkiye)6x Partial secondary sale at $1B+
2022 – 2026
Fund IV The rapid evolution of frontier technologies
$292Mraised171companies
Reflection AI (Greece)3x Open-source AI lab with a $25B valuation in ~2 years
ElevenLabs (Poland)3x Global leader in voice AI with a valuation of $11B
ICEYE (Poland)4x Sovereign intelligence from space valued at $12B+
Runway (Chile)1x Generative AI video platform valued at $5B+
2026 →
Fund V Markets in the making
$320M+raised
Reaching a fifth fund is rare in venture. 80% of VC firms don’t even get to their fourth. Doing it by betting on overlooked markets is rarer still.
That is a testament to what these markets had in them all along, and why we keep expanding the map. With Fund V, we made our first-ever investments in Venezuela and Sudan.
Here is what the last few years investing Elsewhere tell us
01
AI’s next generation is already being built Elsewhere
Forbes’ 2026 AI 50 featured more than a dozen companies and founders built or based outside the traditional US hubs.
This list is early proof, and a blueprint for who comes after.
Companies building Elsewhere
MistralFrance
LovableSweden
ElevenLabsPoland
Black Forest LabsGermany
LegoraSweden
CohereCanada
Founders from Elsewhere
FalTürkiye
ReflectionGreece/UK
RunwayChile/Greece
ReplitJordan
Clay AIEgypt/Saudi/Canada
VercelArgentina
02
Today’s emerging industries are tomorrow’s exits
Through 2022, most liquidity came from commerce and consumer internet businesses reaching maturity. Since 2023, exits have moved decisively toward enterprise software, now the most active exit category.
As AI ecosystems mature across more markets, we expect another big shift: more of the category-defining companies being built and funded today will reach larger scale and, ultimately, exit.
Cumulative number of exits, by category
CommerceB2B SoftwareFintechOther
View as table
Year
Commerce
B2B Software
Fintech
Other
Total
2014
0
1
0
0
1
2015
1
1
0
0
2
2017
2
1
0
0
3
2018
2
1
1
0
4
2019
2
2
2
0
6
2021
5
5
4
2
16
2022
8
7
4
2
21
2023
8
10
5
2
25
2024
8
11
5
2
26
2025
9
15
8
5
37
2026
9
15
9
7
40
Values read from the source chart; replace with the live dataset.
03
Liquidity is entering its next peak
The 2020–2022 era generated $100M+ in proceeds. After a correction period, liquidity is building again: we have seen exits out of every fund in the past 18 months, driving $60M+ in gross proceeds, including the recently announced $4B+ Altruist M&A transaction.
The next wave of exits is projected to generate ~$300M in proceeds from 2027–2030.
Gross proceeds by liquidity era ($M)
AcquisitionIPOSecondary saleProjection
View as table
Era
Acquisition
IPO
Secondary
Total
Build-up 1 (Pre-2020)
9
3
7
19
Peak (2020–2022)
65
20
19
104
Correction (2023–2024)
5
0
4
9
Build-up 2 (2025–2026)
44
0
16
60
Next peak (2027–2030)
100
100
100
300*
* projected
Build-up 2 uses the corrected figures (acquisition $44M, secondary $16M, total $60M). Segment splits for other eras are read from the source chart.
04
The world’s biggest funds are investing Elsewhere for the first time
Even some of the most established names in venture are still finding new ground to enter. In 2025 alone, a16z made its first-ever investment in Pakistan, TPG’s The Rise Fund made its first move into the Middle East, and Tidemark made its first investment in Latin America.
Every one of these firsts is a signal that capital is increasingly following opportunity to markets it hasn’t reached yet, and that the list of “next” is nowhere near exhausted.
Tier 1 funds’ first investments into a new market
1st investment in PakistanZarPakistan
1st investment in MENATPGHalaSaudi Arabia
1st investment in LATAMTidemarkOnflyBrazil
1st investment in MENANYMCARDLebanon
1st investment in BrazilNG.CASHBrazil
Company marks are placeholders until logos arrive; the a16z → Zar pair is the requested addition.
05
The map hasn’t stopped growing bigger, and the returns held
Latin America was at the heart of our early investment strategy, accounting for 65% of capital deployed in 2012. As our strategy expanded globally, the conviction in the region remained strong even as its share evolved to 36% by Q2 2026. Europe’s share more than doubled, led by Spain and Türkiye, while the Middle East produced three breakout markets in succession: the UAE, Egypt, and Saudi Arabia.
We still have many “firsts” in our pipeline.
Share of cumulative capital by region, by year (%)
Latin AmericaEuropeMiddle EastAsiaUS & CanadaAfrica
View as table
Year
Latin America
Europe
Middle East
Asia
US & Canada
Africa
2012
65
35
0
0
0
0
2013
54
46
0
0
0
0
2014
67
31
0
2
0
0
2015
60
32
6
2
0
0
2016
57
21
14
7
1
0
2017
55
17
16
8
2
2
2018
48
21
16
8
4
3
2019
42
18
20
10
5
5
2020
42
19
17
10
6
6
2021
40
16
17
9
8
10
2022
36
19
19
9
8
9
2023
36
18
19
10
8
9
2024
38
18
18
10
8
8
2025
38
20
17
9
8
8
2026
36
22
16
10
8
8
Approximate values read from the source chart; swap in the dataset behind it.
Honoring who got us here
Thank you to our Endeavor Entrepreneurs, LPs, mentors, co-investors, partners, and the extended global community building Elsewhere.